Last reviewed 6 September 2026
Commercial solar quotes go wrong when they’re sized to roof area instead of how the business actually uses power. Interval data — the half-hour or similar readings from your meter — is the antidote. Before you buy, learn to read the shape of your demand, not just the monthly total.
This checklist is for Tasmanian businesses on TasNetworks connections. We’re not inventing percentage savings or payback years. We’re showing what to look for so a design matches weekday reality.
Why monthly bills aren’t enough
A quarterly bill tells you how much you used. Interval data tells you when. That matters because solar produces through the middle of the day. If your site peaks at 7:30 am when staff arrive and again after 4 pm when solar is falling, a huge array without storage or load control may export at noon and still leave you importing hard at the edges of the day.
On many TasNetworks business tariffs, common peak windows sit in weekday mornings and late afternoon/evening — we always confirm against your actual tariff and network assignment rather than assuming a generic mainland TOU calendar.
We’ve seen packing sheds that look “high use” on a quarterly bill but barely draw through the classic solar window because the heavy kit runs early and late. We’ve also seen coolstores with a beautiful midday coincidence that a bill alone would never reveal. The CSV is the difference between a roof-led quote and an energy-led design.
The practical checklist
1. Pull at least a year if you can
One sunny fortnight lies. You want winter school holidays, summer peaks, and any shutdown periods. If you’ve only got three months, say so on the brief — the design confidence drops with the data.
Seasonality in Tasmania is not subtle. A tourism operator’s summer shape can be nothing like July. A school or office with holiday shutdowns will show troughs that a single busy month hides. Ask your retailer or metering provider for the longest clean export you can get.
2. Plot weekday vs weekend
Retail, hospitality, and manufacturing rarely share the same shape. Weekday mornings often show a sharp climb; weekends may be flat or spiky depending on trading hours. Solar that looks perfect on a Saturday graph can miss Monday’s open.
3. Mark the solar window
Roughly late morning through mid-afternoon is when a north-facing Tasmanian array works hardest (orientation and shading still rule). Shade that band on your interval chart. How much of your load already sits inside it? How much sits outside?
East-west roofs and shade from neighbouring sheds change the generation shape. The point of marking a window is not to pretend every site is identical — it’s to force an honest overlap conversation before anyone counts modules.
4. Separate base load from spikes
A steady compressor or coolroom load is a different design problem to a once-a-day oven bank or EV fleet return. Spikes may need process timing, not just more panels.
5. Note maximum demand behaviour
If your tariff includes demand charges, the height of short peaks can matter as much as energy (kWh). Solar can shave daytime demand; it won’t help a 6 pm spike unless you also shift load or add storage. We flag this without inventing a demand-charge saving percentage.
6. Check export assumptions early
Commercial systems can sit outside basic micro-EG pathways depending on size. Export may be limited or non-export by design. Don’t let a quote assume unlimited export into a constrained network pocket. Align the electrical design with TasNetworks requirements before you fall in love with a panel count.
Mid-scale conversations (including evolving STC eligibility for larger onsite capacity) still rest on connection reality. Certificates do not invent export headroom. See our commercial services page once you’ve read the meters.
7. List planned electrification
Heat pump HVAC, electric hot water, forklifts, or fleet chargers change the interval shape after install. Tell us what’s coming in the next 12–24 months so we don’t undersize the switchboard story.
8. Decide what “success” means
Examples of clear goals: cover weekday base load in the solar window; reduce imported energy on operating days; prepare the roof for staged expansion. Vague goals (“maximise savings”) produce vague systems.
Tasmanian scenarios we design around
- Regional warehouse: weekday forklifts and lighting, quiet Sundays — size to operating days, not to empty-roof fantasies.
- Food processing / coolstore: strong base load that can soak midday generation if process timing cooperates.
- Agricultural packing shed: seasonal spikes; a year of data (or honest seasonal notes) beats a single harvest week.
- Hospitality: lunch and dinner peaks may sit poorly against solar unless prep loads and HVAC are timed carefully.
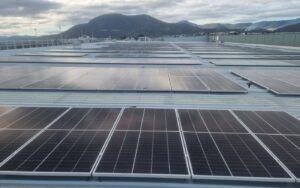
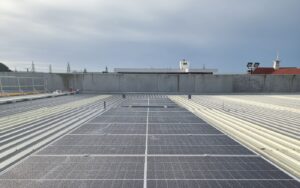
For commercial delivery examples, see our work on Bunnings warehouse solar across Tasmania and the commercial off-grid EPC at Mount Rumney Escapes. Different problems, same discipline: design to the site’s energy behaviour.
Service overview: commercial solar panels.
Reading charts without becoming a data scientist
You don’t need fancy software to start. Open the CSV in a spreadsheet, filter to weekdays, and chart average demand by half-hour. Mark roughly 10 am–3 pm. If most of your energy sits outside that band, a panels-only quote that assumes high self-consumption needs a harder look — or a plan for load shifting, storage, or a smaller array matched to the true midday base.
If the chart shows a flat weekday base inside the solar window (coolrooms, servers, continuous process), coincidence may already be on your side. That’s when commercial solar often earns its keep without heroic assumptions.
How we use your data at Expert Energy Tasmania
When you send interval exports (CSV from your retailer or metering provider), we look for coincidence between generation potential and load — then propose a system that respects connection limits. Sometimes the right answer is a modest array tightly matched to daytime process load. Sometimes it’s solar plus storage. Sometimes it’s fix the tariff or process timing first.
We’ll tell you when the data is thin. A confident panel count on three messy months of metering is a sales habit, not an engineering habit.
What to send us
- Interval data file (ideally 12 months)
- Latest bill showing tariff / network codes
- Single-line diagram or switchboard photos if you have them
- Roof photos or a site plan
- Notes on operating hours and planned equipment changes
If interval data isn’t available yet, we can still do a site walk and estimate from bills — but we’ll tell you the uncertainty band instead of pretending it’s precise.
What to ask us before you buy
- What share of my weekday load sits inside a realistic solar window?
- What export or non-export assumption is in the financial model?
- How sensitive is the design to winter vs summer shapes?
- Should we stage capacity after we see post-electrification intervals?
What we won’t put in a blog
No invented “cut your bill by X%” claims. No fake payback years. Commercial outcomes depend on tariff, export, uptime, and how closely generation matches load. Those belong on a proposal built from your meters.
Author: Scott Logie · Brand: Expert Energy Tasmania · Last reviewed: 6 September 2026
Book a commercial site and energy assessment — or send your interval data. Contact Expert Energy Tasmania and we’ll read the shape of your demand before we talk panel counts.